Breaking Through the AMP Debugging Bottleneck: JTAG Emulation for RK3568
In embedded Linux development, serial port debugging is commonly favored for its simplicity and accessibility. However, when deploying applications in an AMP-based real-time environment, these limitations become significantly more pronounced—namely poor real-time capability, high system overhead, and limited debugging depth. These drawbacks are especially evident in multi-core collaborative workflows, where tasks such as precisely analyzing inter-core synchronization mechanisms, interrupt timing behavior, or shared-resource conflicts often exceed the capabilities of traditional serial debugging methods.
JTAG Debugging Technology: A Precision Solution to This Pain Point
JTAG (Joint Test Action Group) debugging technology is an internationally standardized technology widely used in embedded system development and hardware testing. It possesses deep interaction and real-time control capabilities, allowing users to set breakpoints online and perform single-step debugging, while also supporting the real-time viewing and modification of register and variable values. More critically, its non-intrusive debugging mode eliminates the need to insert print statements into the code, preserving the original program logic and operational performance to the greatest extent. It can also pause the CPU at any time to accurately capture the complete system state at a given moment, enabling the rapid localization of various complex debugging challenges.
Solution Architecture: An Integrated JTAG Debugging Workflow
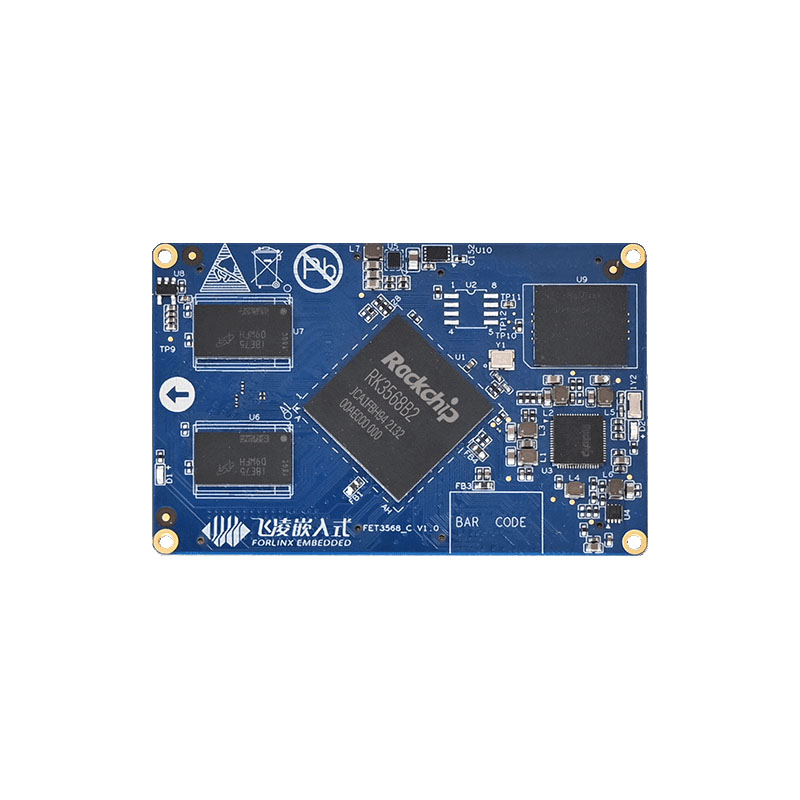
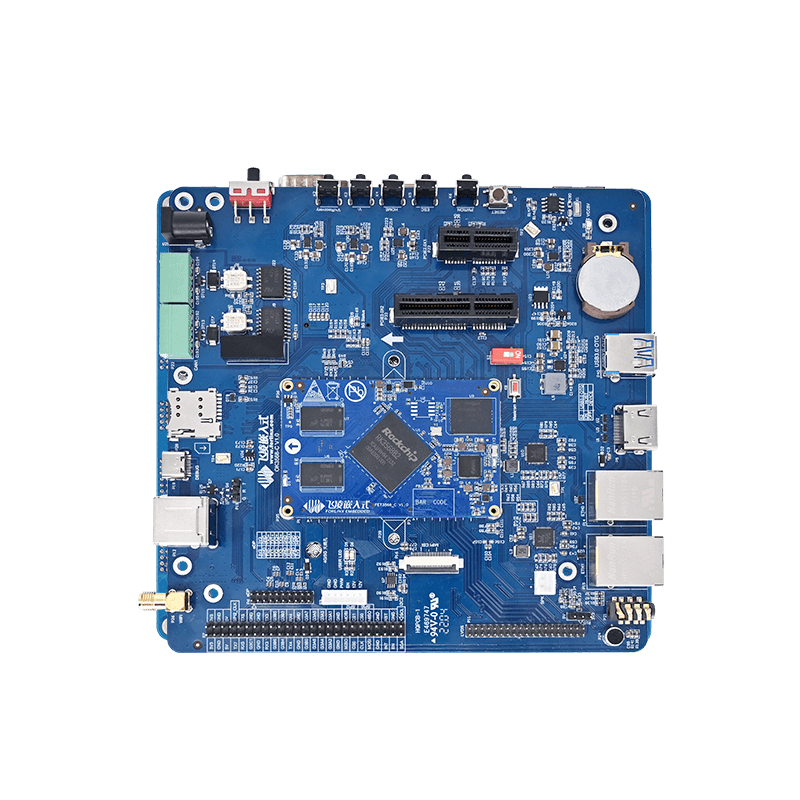
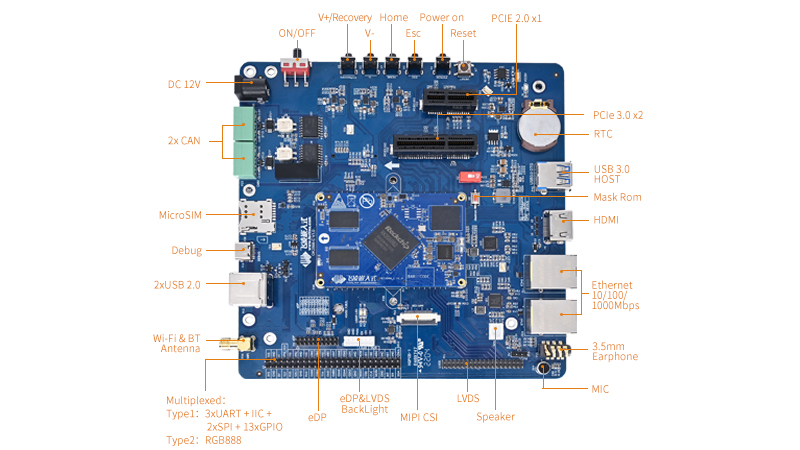
Here, we use the Forlinx OK3568-C development board (based on the Rk3568) for the demonstration:
Forlinx delivers a tightly integrated toolchain that enables seamless JTAG debugging within a Windows environment.
There are three key layers: the Development Host, the Hardware Interface, and the Target Device.
The development host layer is based on Eclipse IDE, integrates CDT development tools and GNU MCU Eclipse plug-ins, and provides a friendly graphical interface. Debugging instructions are generated by GDB, converted by OpenOCD protocol, and finally communicated with RK3568 chip through J-Link hardware interface.
The key strength of this architecture lies in its integration and transparency. Developers can focus entirely on code logic and problem-solving without dealing with low-level communication complexities.
Debugging in Practice: A Visual and Interactive Workflow
1. Breakpoint Control
With Forlinx's JTAG solution, breakpoint debugging is intuitive. Engineers can set breakpoints by double-clicking on the left side of the code, where program execution automatically pauses, making it easy to check the state of all core variables, registers, and memory at the moment.
(1) Set a breakpoint: Double-click the left side of the code. When a "blue ball" appears, it indicates that there is a breakpoint here. The program will stop here.
(2) Cancel the breakpoint: Double-click the "blue ball" on the left side of the code. When the ball disappears, it means that the breakpoint here is cancelled.
(3) Ignore all breakpoints: At this time, all breakpoints are cancelled and the program can run at full speed.
2. Single-step and Multi-step Execution
There are several modes of single-step execution: Step Over can skip the function call, Step Into can go deep inside the function, and Step Return can quickly execute the rest of the current function.
Multi-step execution: including "Run to the cursor" and "Continue to run" to meet the needs of different scenarios.
3. Variable Inspection
(1) Local Variables update in real time within the current function scope and can be modified directly.
(2) Global Variables remain accessible throughout the session, providing a live view of system-wide state when paused.
4. Memory Inspection
(1) Direct Access and Modification
Using the Memory Browser, engineers can read any memory or register address to inspect content or verify configurations.
(2) Live Editing
Values can be written directly to specified addresses, enabling dynamic data changes or peripheral register updates.
The JTAG debugging solution outlined above, tailored for AMP multi-core collaborative scenarios, significantly lowers the technical barrier to entry for real-time core debugging. By visualizing the debugging process and enabling simultaneous monitoring of AMP real-time core states, it makes actions like program jumps and task switching much clearer. We hope this solution will be helpful to your development work.