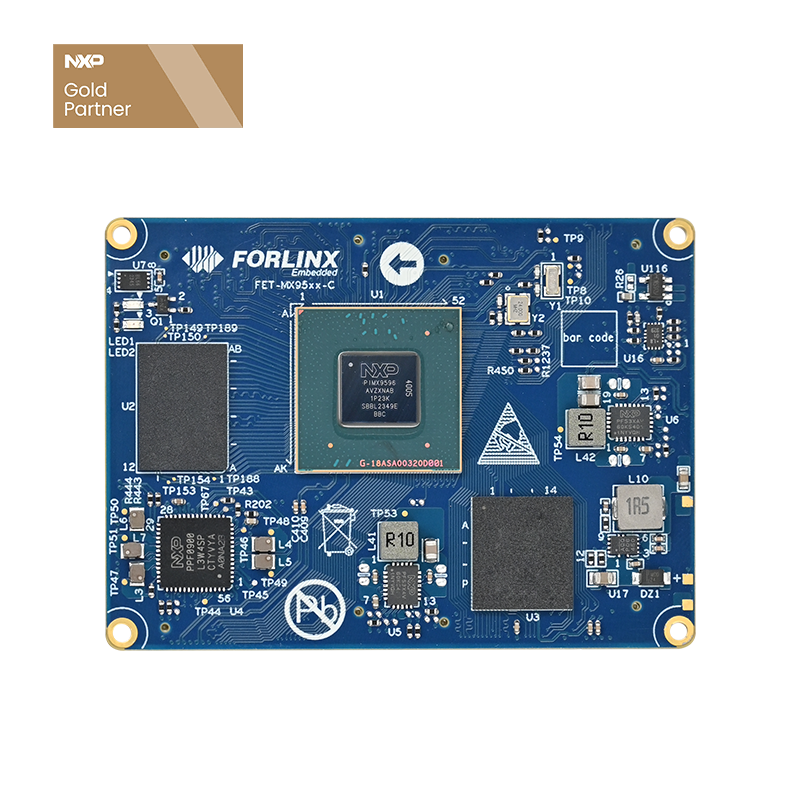
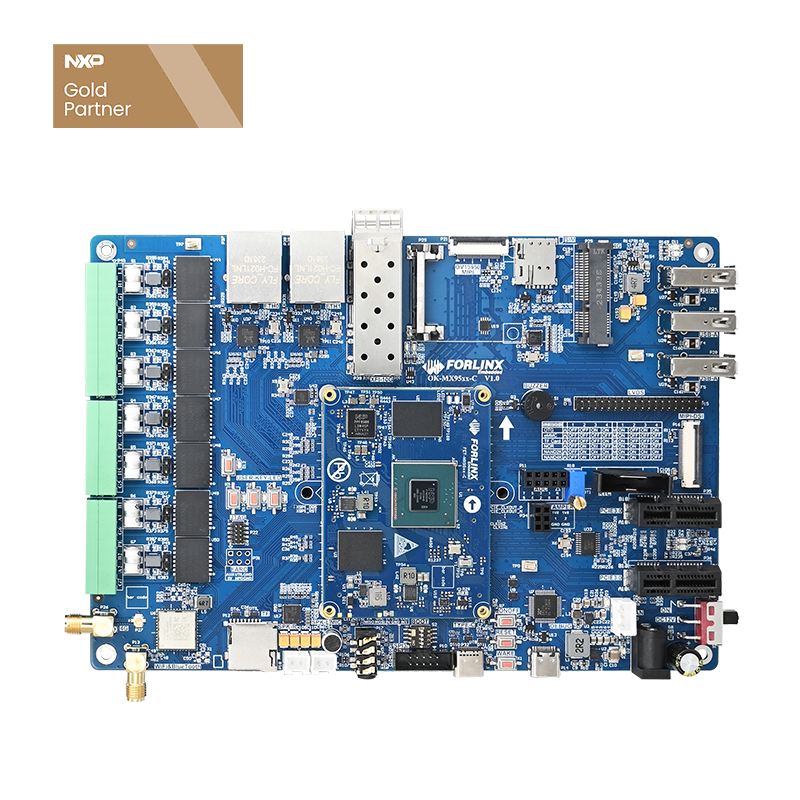
OKMX9596-C GPIO Capture Function Verification
In application scenarios such as industrial control, edge computing, data acquisition, and device collaboration, GPIO can not only be used as a general input/output interface but also handle tasks such as external event triggering, pulse counting, frequency statistics, and synchronous signal capture. Especially in scenarios involving multi-device collaboration or high-precision event detection, GPIO capture capability directly affects system response speed, event statistics accuracy, and overall real-time performance.
Based on the OKMX9596-C platform, Forlinx Embedded has verified the GPIO capture function in the Linux system. By combining kernel interrupt counting, periodic timer sampling, sysfs output, and application-layer delay statistics, an effective evaluation of GPIO interrupt frequency and response jitter has been achieved. This provides a reference solution for industrial device synchronization, external pulse acquisition, high-frequency event detection, and similar scenarios.
Application Background: The Value of GPIO Capture in High-Precision Synchronization Scenarios
In conventional systems, device synchronization can usually be achieved through network time synchronization methods such as NTP or PTP. However, in some industrial sites, local network devices, standalone acquisition systems, or environments with limited network conditions, devices may not be able to rely on standard network time synchronization solutions. In such cases, external GPIO signals can serve as a simple and reliable synchronization trigger method.
| Application | Description |
| Multi-device Synchronous Acquisition | External trigger signals unify the sampling rhythm across multiple nodes |
| External Pulse Counting | Counting external periodic signals or sensor output frequency |
| Industrial Control Event Triggering | Capturing device status changes, limit signals, or alarm inputs |
| Edge Node Collaboration Notification | Providing auxiliary synchronization mechanisms in network-limited scenarios |
These applications place higher demands on GPIO capture. The system must not only detect edge changes but also accurately count interrupt occurrences while minimizing interrupt response latency and system scheduling jitter.
Implementation Methods for GPIO Capture
From an implementation perspective, high-precision GPIO capture can generally be classified into several categories, including GPIO interrupts, GPT input capture, and TPM input capture.
| Mechanism Name | Core Technical Principle | Precision and Jitter | Interrupt Latency Dependency | Hardware Pins | Applications |
| GPIO Interrupt | Edge-triggered ISR immediately reads hardware timers (e.g., ARM Generic Timer/CPU cycle counter) to generate timestamps, which are then passed to the user space via ring buffers/queues. Generate via software. | Jitter ranges from several microseconds to tens of microseconds, unable to meet nanosecond-level precision. | Dependent. Affected by interrupt masking and high-priority tasks. | Does not occupy additional hardware pins, highly versatile. | Non-critical timing, general IO events. |
| GPT Input Capture | GPIO signals are routed to general-purpose timer capture pins (IC). When an edge arrives, the hardware automatically latches the counter value into the capture register and then triggers an interrupt to notify the CPU. | Hardware instant latching, clock typically tens of MHz, resolution up to tens of nanoseconds, extremely low jitter. | Independent. | Requires dedicated GPT capture pins. | High-precision period/pulse width measurement. |
| TPM Input Capture | Hardware capture provided by dedicated timer/PWM modules, with hardware latching mechanisms consistent with GPT. Supports richer edge detection (rising/falling/both edges), input filtering, and DMA. | Nanosecond-level hardware timestamp, precision determined by timer clock frequency. | Independent. | Requires dedicated TPM capture pins. | Motor control, power management, and advanced scenarios requiring synchronisation and dead-time insertion. |
GPIO interrupt methods offer stronger versatility. When a GPIO edge is triggered, the system enters the interrupt service routine (ISR), recording events, counting, or reading timestamps within the interrupt. This method does not rely on additional hardware capture resources and has broad applicability, but its precision may be affected by factors such as system interrupt latency, task scheduling, and high-priority task occupation.
GPT input capture is a hardware capture solution. It utilizes the input capture channels of the SoC’s internal general-purpose timer. When a signal edge arrives, the hardware automatically latches the current counter value and notifies the CPU to read it. Since timestamps are directly latched by hardware, precision is higher, and jitter is lower, making it suitable for high-precision period, pulse width, and frequency measurement.
TPM input capture is similar to GPT and is typically provided by timer/PWM modules, supporting rising-edge, falling-edge, both-edge detection, input filtering, DMA, and other functions. This method also belongs to the hardware timestamp solution and is suitable for scenarios requiring high capture precision.
In the verification on the Linux A-core side of the OKMX9596-C platform, the GPIO interrupt method was prioritized for capture capability testing. This approach offers good versatility and implementation flexibility, enabling quick evaluation of the platform’s GPIO interrupt response and frequency statistics capabilities in the Linux system.
Limitations of the Traditional gpio_keys Solution
In the Linux system, the common gpio_keys driver is primarily designed for low-frequency scenarios such as button inputs. This method typically reads events via application-layer poll/read operations, making it suitable for general button presses or status inputs but not for high-frequency GPIO capture.
In high-frequency interrupt scenarios, traditional methods face three main issues: significant user-space scheduling delays; high-frequency events can easily accumulate when notified to user space one by one; and application-layer self-timing and interrupt accumulation may be affected by thread scheduling, system load, and wake-up jitter, making it difficult to accurately reflect the actual interrupt frequency.
Therefore, in high-frequency GPIO capture or high-precision synchronization scenarios, it is more appropriate to implement core counting logic in the kernel space and then have the user space read statistical results and observe end-to-end response performance.
Forlinx Implementation Approach: Interrupt Counting Only, Periodic Timer Sampling
This verification adopts the implementation method of “GPIO interrupt counting + kernel timer sampling + sysfs output.” The overall approach is as follows: After a GPIO edge triggers an interrupt, only atomic counting is performed in the ISR; a kernel timer periodically reads and clears the count value; statistical results are written to frequency variables; frequency data is output via the sysfs interface; and the application layer blocks reads events and statistics response intervals.
The core principle of this design is: Keep interrupt handling as short as possible and delegate complex statistics to periodic timers.
Driver Key Code
static irqreturn_t gpio_irq_handler(int irq, void *dev_id)
{
    struct gpio_irq_data *data = dev_id;
    atomic_inc(&data->event_count);
    spin_lock(&data->lock);
    data->data_active = true;
    spin_unlock(&data->lock);
    wake_up_interruptible(&data->queue);
    return IRQ_HANDLED;
}
static void timeout_callback(struct timer_list *t)
{
    struct gpio_irq_data *data = from_timer(data, t, timer);
    unsigned long flags;
    int event_count;
    spin_lock_irqsave(&data->lock, flags);
    event_count = atomic_read(&data->event_count);
    if (event_count == 0) {
        data->data_active = false;
    } else {
        atomic_set(&data->event_count, 0);
        data->data_active = true;
    }
    data->status_changed = true;
    data->last_freq = event_count;
    wake_up_interruptible(&data->queue);
    spin_unlock_irqrestore(&data->lock, flags);
    mod_timer(&data->timer, jiffies + msecs_to_jiffies(data->timeout_ms));
}
In the interrupt service routine (ISR), only atomic_inc is used to increment the event count and wake up the wait queue. Complex computations, print operations, or user-space notifications are avoided within the ISR. This reduces the execution time in interrupt context and lowers system load in high-frequency input scenarios.
In the timer callback, the accumulated interrupt count is read via atomic_read, then cleared with atomic_set. Read and clear operations are protected by a spinlock to ensure no missed or duplicate counts when executed concurrently with the ISR. Subsequently, the driver writes the statistical result into last_freq and wakes up the blocked read operation.
Application-Layer Statistics: Observing End-to-End Response and Jitter
The driver-side freq provides the kernel’s statistical interrupt frequency, which is used to determine whether GPIO input events are accurately counted. To further observe system response performance, the application layer can call clock_gettime(CLOCK_MONOTONIC) immediately after each read returns to obtain a timestamp.
The time difference between two consecutive read returns reflects the actual interval between two sampling events. This interval includes end-to-end factors such as kernel timer scheduling, user-space wake-up, and application thread scheduling, making it suitable for analyzing overall system response jitter.
Application-Side Statistical Code:
while (running) {
    ret = read(fd, buf, sizeof(buf));
    if (ret < 0) { if (errno == EINTR) continue; perror("read error"); break; } if (ret == 0) continue; uint64_t now_ns = get_ns(); if (count == 0) { first_ns = now_ns; last_ns = now_ns; last_print_time = now_ns; count = 1; continue; } interval_ns = now_ns - last_ns; last_ns = now_ns; count++; if (interval_ns < min_interval) min_interval = interval_ns; if (interval_ns > max_interval) max_interval = interval_ns;
    sum_interval += interval_ns;
    if ((now_ns - last_print_time) >= 1000000000ULL) {
        double elapsed_sec = (now_ns - first_ns) / 1e9;
        double rate = count / elapsed_sec;
        double avg_interval_us = (count > 1) ?
            (sum_interval / (double)(count - 1)) / 1000.0 : 0;
        printf("[%6.2f s] events=%lu, rate=%.1f Hz, avg_interval=%.1f us, min=%.1f us, max=%.1f us\n",
               elapsed_sec, count, rate, avg_interval_us,
               min_interval / 1000.0, max_interval / 1000.0);
        last_print_time = now_ns;
    }
}
The application layer can periodically output event count, real-time rate, average interval, minimum interval, and maximum interval. By comparing the driver-side freq with the application-side statistical results, it is possible to determine whether there are interrupt losses, user-space read delays, or system scheduling anomalies.
Test Results: Achieving ~408kHz Interrupt Frequency Statistics
In tests on the OKMX9596-C platform, GPIO interrupt frequency statistics can be directly obtained by reading the sysfs node:
cat /sys/class/gpio_irq_class/gpio_irq/freq
The actual measurement results show that the frequency values obtained from multiple reads are stable at around ~408kHz, for example: 408664, 408739, 408657, 408658. This result demonstrates that the method based on kernel timer atomic sampling of interrupt counts can achieve stable statistics even in high-frequency input scenarios.
Compared to the traditional gpio_keys + application-layer polling approach, this solution reduces the path overhead of transferring each individual event to user-space, making it more suitable for high-frequency GPIO capture capability verification and event statistics in industrial scenarios. At the same time, directly outputting frequency results via sysfs facilitates quick reading by scripts, testing tools, and upper-layer applications, providing convenience for automated testing and system monitoring.
Solution Advantages
Lightweight Interrupt Handling: The ISR only performs atomic counting and necessary wake-ups, avoiding complex logic in interrupt context.
More Accurate Kernel-Side Counting: Interrupt counting is completed within the kernel, independent of real-time scheduling of user-space threads.
Stable Timer-Based Periodic Sampling: Periodic sampling and clearing via kernel timers reduce statistical errors introduced by application-layer self-timing.
Sysfs Output for Easy Integration: Frequency results can be directly read via sysfs, facilitating calls from shell, Python, C applications, or upper-layer business logic.
Adapted to Industrial High-Frequency Event Scenarios: Can be extended to applications such as external pulse counting, synchronous triggering, event capture, and industrial control input detection.
Applicable Scenarios
Industrial equipment synchronous triggering, external pulse input detection, high-frequency GPIO event statistics, multi-device synchronous acquisition, edge gateway event capture, motor/sensor/control signal frequency detection, auxiliary synchronization when network time synchronization is unavailable, industrial field status change monitoring.
For scenarios requiring further improvement in timestamp precision, this can be combined with M-core real-time processing, independent RTC, hardware capture channels, or real-time system optimization schemes to further reduce latency and jitter.
Summary
Forlinx Embedded has validated GPIO capture capabilities under the Linux system based on the OKMX9596-C platform. By combining GPIO interrupt counting, kernel timer periodic sampling, sysfs output, and application-layer delay statistics, stable statistics for high-frequency GPIO interrupt events were achieved.
This solution avoids the issues present in the traditional gpio_keys driver in high-frequency scenarios, such as large user-space scheduling delays, untimely event reading, and affected statistical accuracy. Test results show that the OKMX9596-C platform can achieve GPIO interrupt frequency statistics at the ~408kHz level, providing a referable technical path for high-precision event capture, industrial synchronous control, and edge device coordination.
In the future, Forlinx will continue to conduct technical validation and solution refinement around the industrial control, real-time processing, edge computing, and heterogeneous multi-core capabilities of the OKMX9596-C platform, providing stable, efficient, and implementable embedded platform support for more industrial intelligent devices.